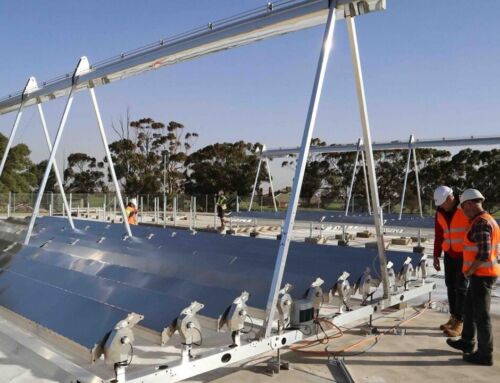
The Sustainable Campus Dashboard is a publicly accessible, dynamic, and interactive dashboard. It enables users to observe trends and historical data on – energy consumed the flow of chilled water, and solar power generated at UWA’s Crawley campus (will expand to include additional metrics over time).
Does the initiative relate to UWA’s sustainability strategy?
The Sustainable Campus Dashboard is a part of the Energy Smart Campus initiative, which utilises the University as a ‘living laboratory’. This dashboard also plays a pivotal role for UWA, which is on track to be an energy-neutral campus. It is also closely related to the other energy-saving initiatives across the Crawley campus.
What challenges has this initiative navigated?
The biggest and ongoing challenge is getting access to good-quality metering data. Our campus has a lot of older buildings that are not set up to be metered or have old meters that don’t play nicely with the newer technology. Even once everything is connected, standardising the data, understanding how all the meters relate to each other, and modelling those relationships in the data has been tricky.
There is a need to continually monitor, diagnose and rectify faults due to equipment or network failure. Overall, expanding and maintaining an already extensive network of IoT devices is expensive and time-consuming, but its oversight and insights are worth it.
What advice would you give to other organisations looking to replicate this initiative?
Start with a small proof of concept, and engage your academics and students in the process! Either choose one building and meter it in detail or choose multiple buildings and monitor just the overall consumption. Get used to asking questions and experimenting with energy reduction strategies, then following your questions to add more meters as needed.
It is important to have access to the appropriate expertise in engineering, metering, and IT. Given the workflow (from understanding the operation of services within the building, determining what should be metered, installing the meters, integrating the meters in an energy management system, and working with IT to ingest the various systems into a public dashboard), issues could arise at any stage, and the various technical experts need to work together to diagnose and solve problems.
Arrange monthly meetings attended by all parties to monitor the data and discuss any non-readings, anomalies in data, adding new meters, etc.


